Your cart is currently empty!

This is a basic guide on Facebook Analytics statistics, where you will learn how to use Facebook statistics even if you’ve never used this tool before!

Since mid-last year, Facebook Analytics was retired, but in its place, we can now use similar tools like Meta Business Suite, which allows you to manage your Facebook and Instagram business accounts and shows you detailed statistics about your audience, content, and trends.
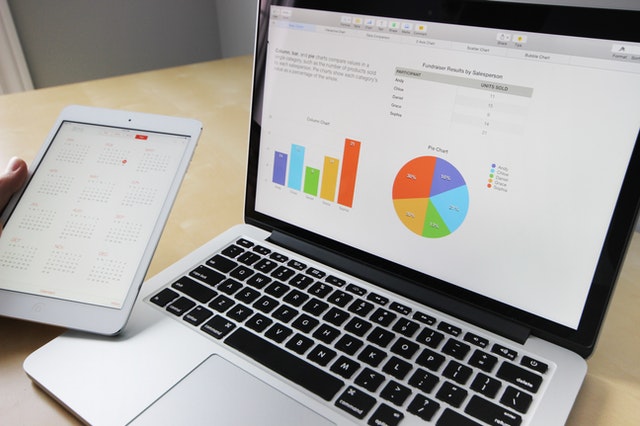
Thanks to the insights provided by Meta Business Suite, you can check the results of your organic and paid social media initiatives on platforms like Facebook and Instagram in one place. It also allows you to access metrics, trends, and visual reports, which can help you understand which strategies are working and which are not. With all this information, you can optimize the way you use your time and resources.
But all of this can be quite complicated for those who are not familiar with social media analytics. That’s why today I’m going to present a small guide to understanding statistics and trying to maximize your results on social media.
There are five reasons, which I will list below:

How do you know what has worked and what hasn’t? You have to look back. What type of content has received the most likes? Why did 40 people unfollow you last week? Looking at the concrete data of what happened on your account is essential for learning, growing, and making your social media presence have the greatest possible impact.
This feature allows you to export graphic PDFs, spreadsheets, or charts from the analytics tool of your choice to share clear and concise results and trends. This is ideal for those of us who manage third-party accounts. It’s a great way to show and justify our work.
This will help you know exactly who is participating in and following your content, with demographic and geographic data such as age, gender, and location. It’s also a useful tool to know when your audience is online, the number of followers you have in a certain city, province, or country, etc. All of these answers will help you refine your content to target your strategy in the best way possible.
Facebook page analytics can show you the actions people take on your website, from interacting with posts to clicking on your contact information and clicking through to your website.
While there are general suggestions about the best times to post on social media, this tool will show you the ideal posting time depending on your specific audience.
I will briefly explain each of the 5 tabs we have on our statistics page.

In conclusion, as you have seen, with this incredible amount of data and information that this tool provides about your social media work, you cannot afford to skip a weekly visit to check these indicators on what you are doing. I hope this content helps you maximize your performance and obtain the best possible results on your social media.
See you in the next post!